CensusSight is SSDAN’s new interactive mapping tool that makes Census and ACS data easy for anyone to explore. It is simple to use, free to access, and designed so most people can understand and navigate it with ease. Users can view key statistics and trends across the United States, including population change, race and ethnicity, income, and education. With clear visuals and interactive maps, CensusSight helps people see how their communities are changing and understand the broader demographic patterns shaping the nation.
1. Start with a national view
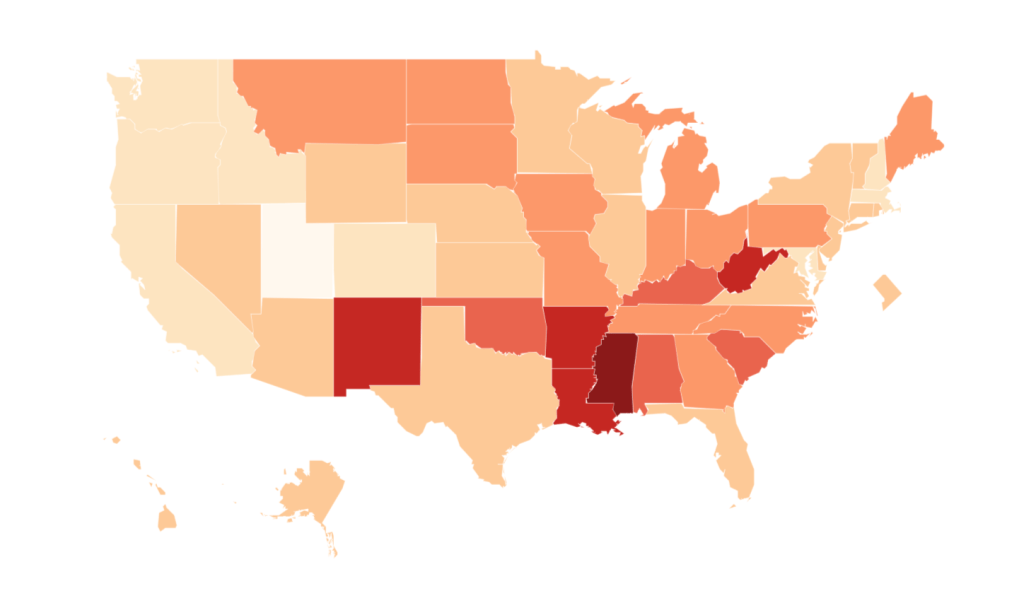
Start by viewing an interactive U.S. map that displays a selected statistic such as education level, poverty rate, or population change. Users can observe regional differences and broad geographic patterns that provide context for more detailed state and county data.
2. Click any state to explore more
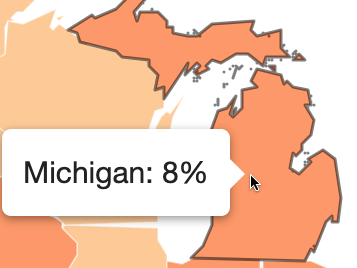
Hovering over different parts of the national map displays key statistics for each state, allowing users to compare values and identify patterns. From this view, users can click a state to explore further and zoom in for a closer look at local data.
3. Examine local patterns
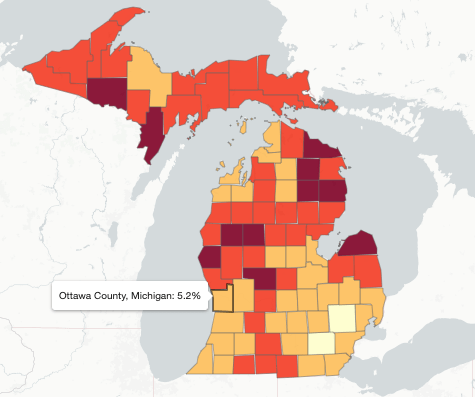
At the county level, the map reveals local variation across each state. Hovering over a county highlights its data and enables comparison with surrounding areas.
4. Explore connections
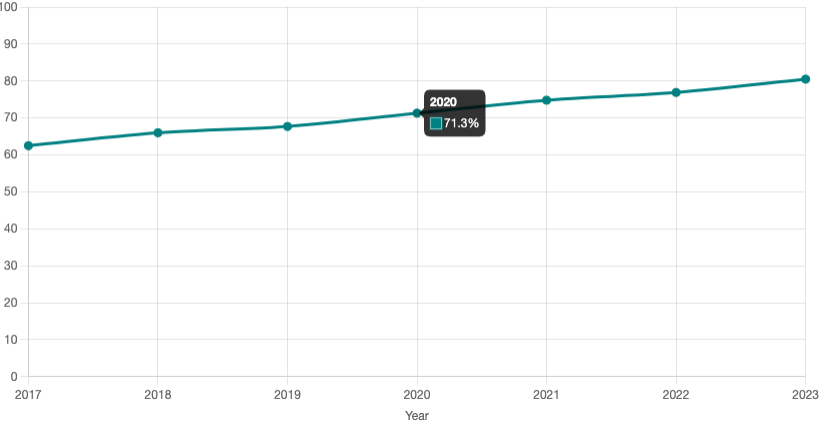
Alongside each map, interactive tables and charts show related measures that help explain why a trend might look the way it does. For instance, a map of poverty rates might link to data on employment, income, or education, allowing users to uncover patterns and insights.